ggplot 修改离散坐标的顺序
ggplot作图默认对分类数据采用字母顺序进行排序(如下图中横坐标所示)序,我们可以对其进行重新排序,以使图形更加美观或更能清楚的表达数据模式。有两种方法可以实现这种结果:
set.seed(100)
library(ggplot2)
library(dplyr)

tb <- tibble::tibble(
  x = letters[1:10],
  y = sample(10, 10)
)

ggplot(tb, aes(x, y)) +
  geom_col()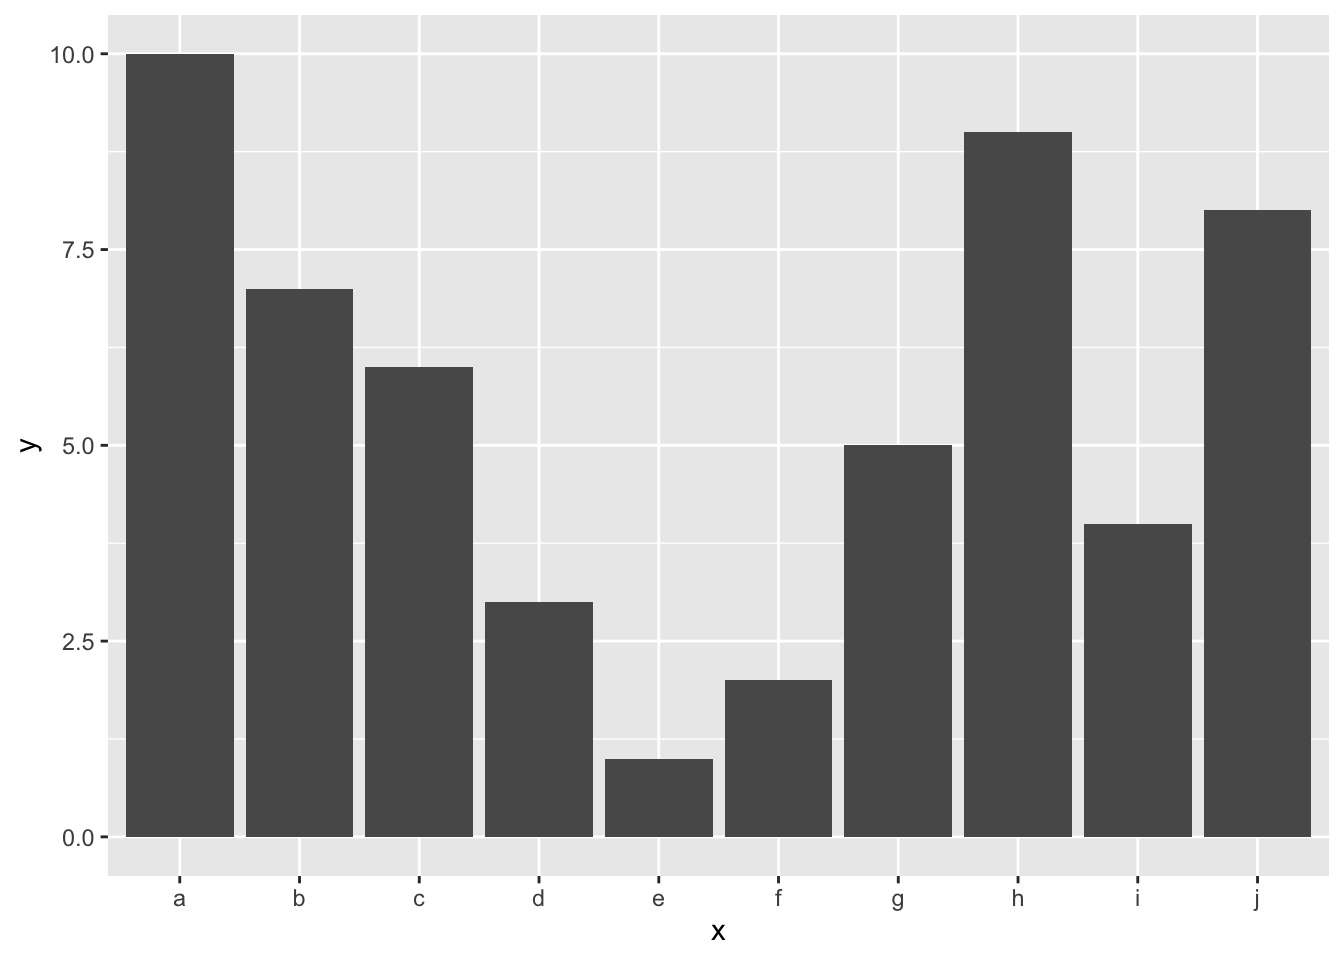
一是利用scale_x_discrete()的limits参数
tb_ordered <- dplyr::arrange(tb, y)
ggplot(tb, aes(x, y)) +
  geom_col() +
  scale_x_discrete(limits = tb_ordered$x)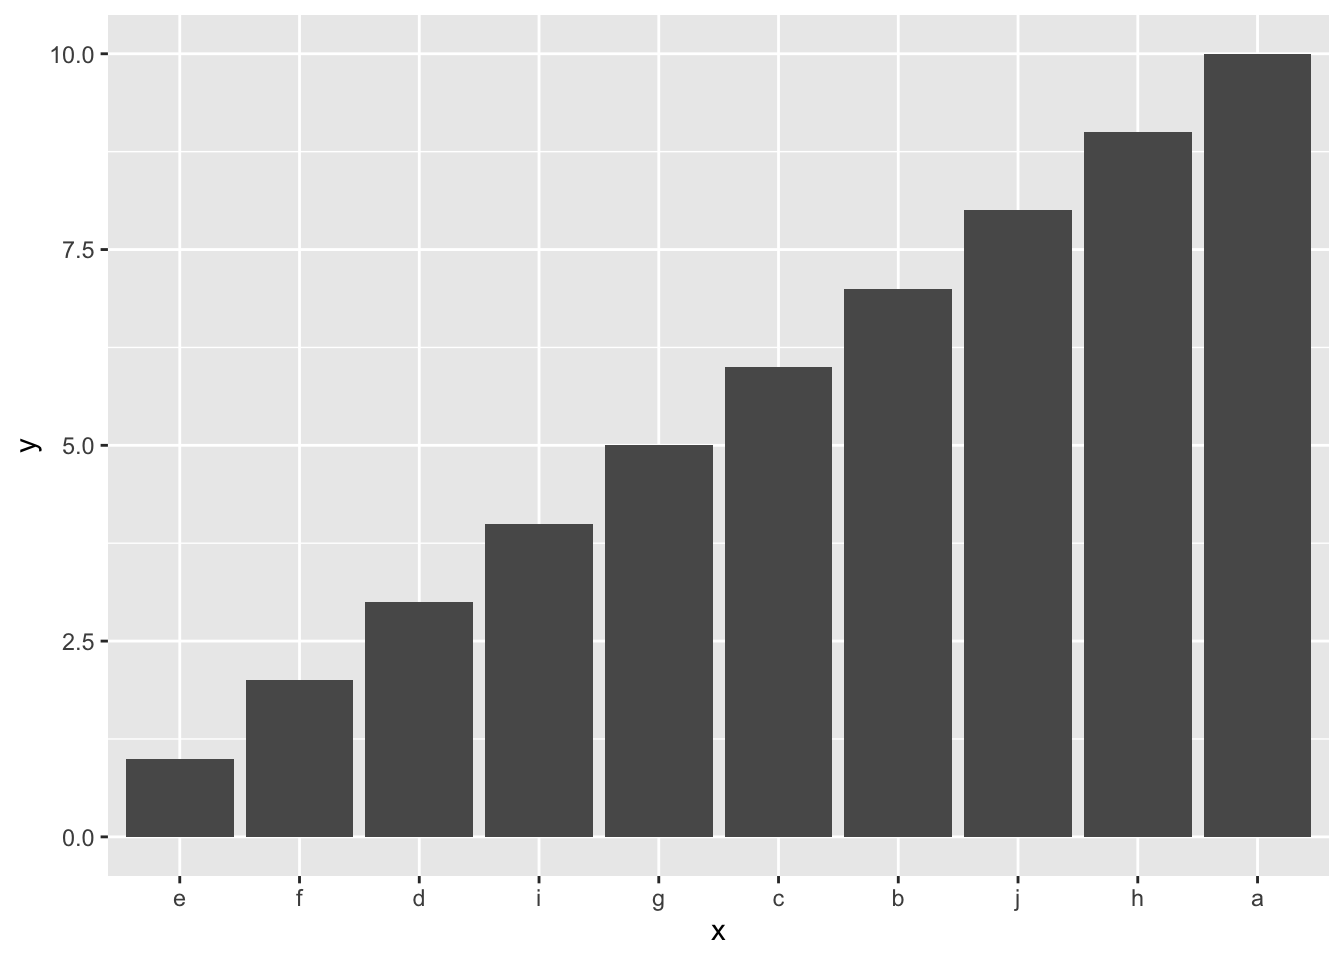
二是利用forcats包中的fct_reorder()
# fct_rev() 反向排序
ggplot(tb, aes(forcats::fct_reorder(x, y) %>% forcats::fct_rev(), y)) +
  geom_col()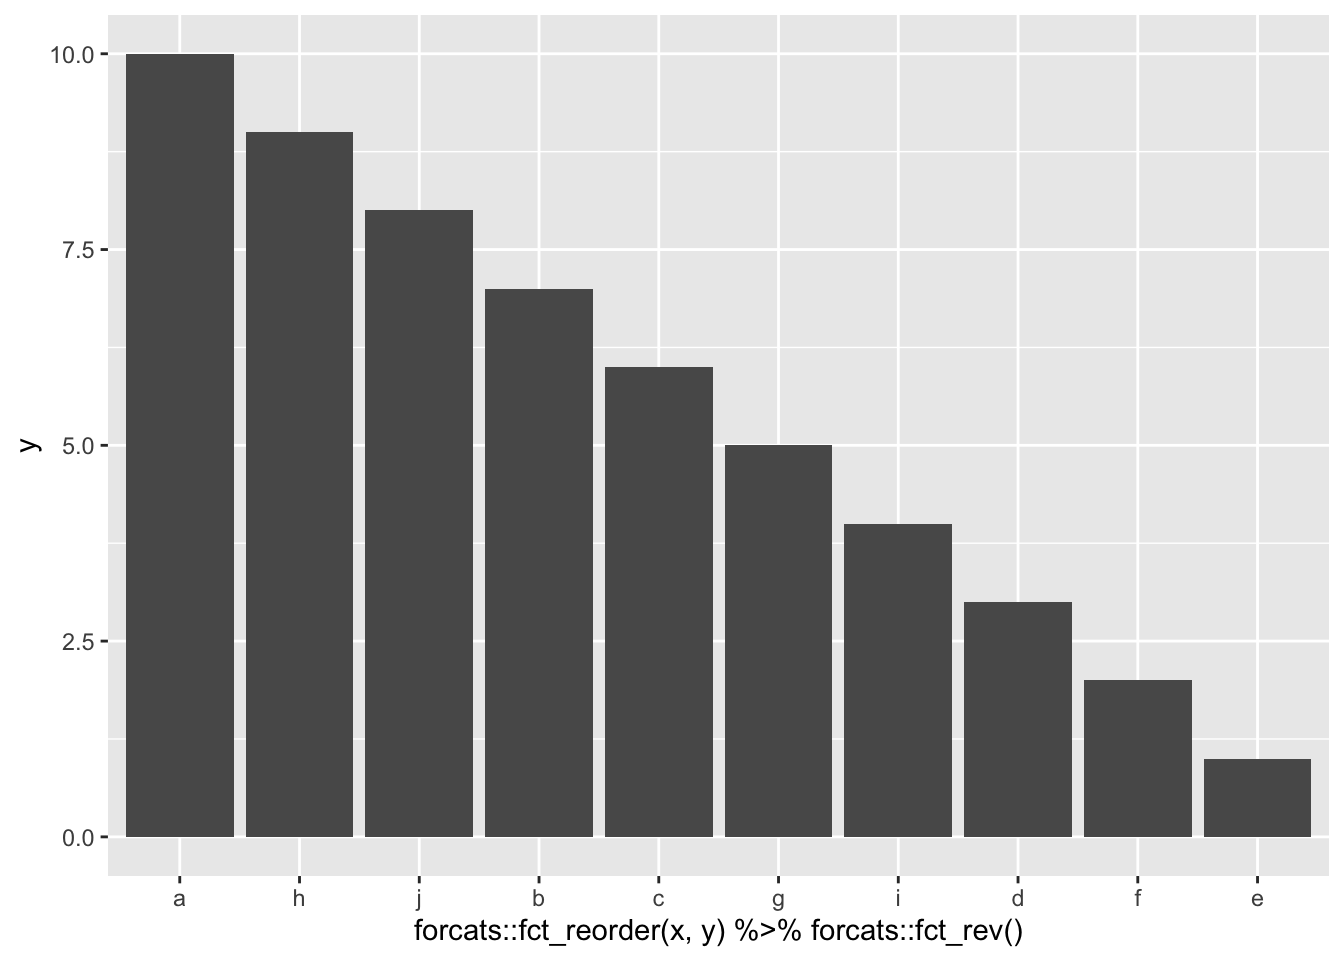
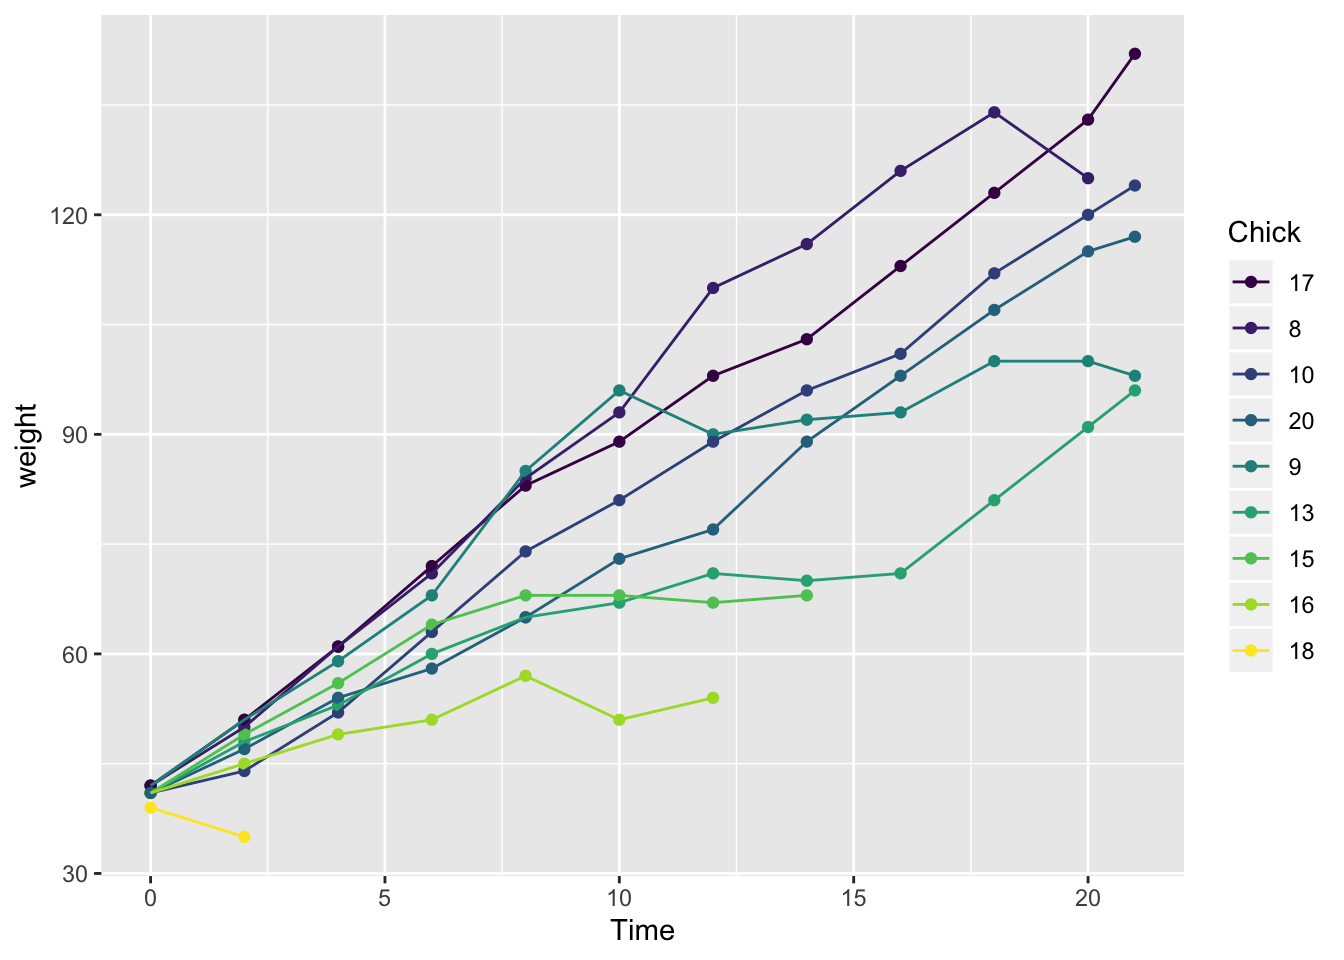
此外,如果线图中有多种颜色的线条,分组排序也有用。如下图所示,我们希望legend的颜色跟线条颜色排列一致。
chks <- subset(ChickWeight, as.integer(Chick) < 10)
ggplot(chks, aes(Time, weight, colour = Chick)) +
  geom_point() +
  geom_line() +
  labs(colour = "Chick")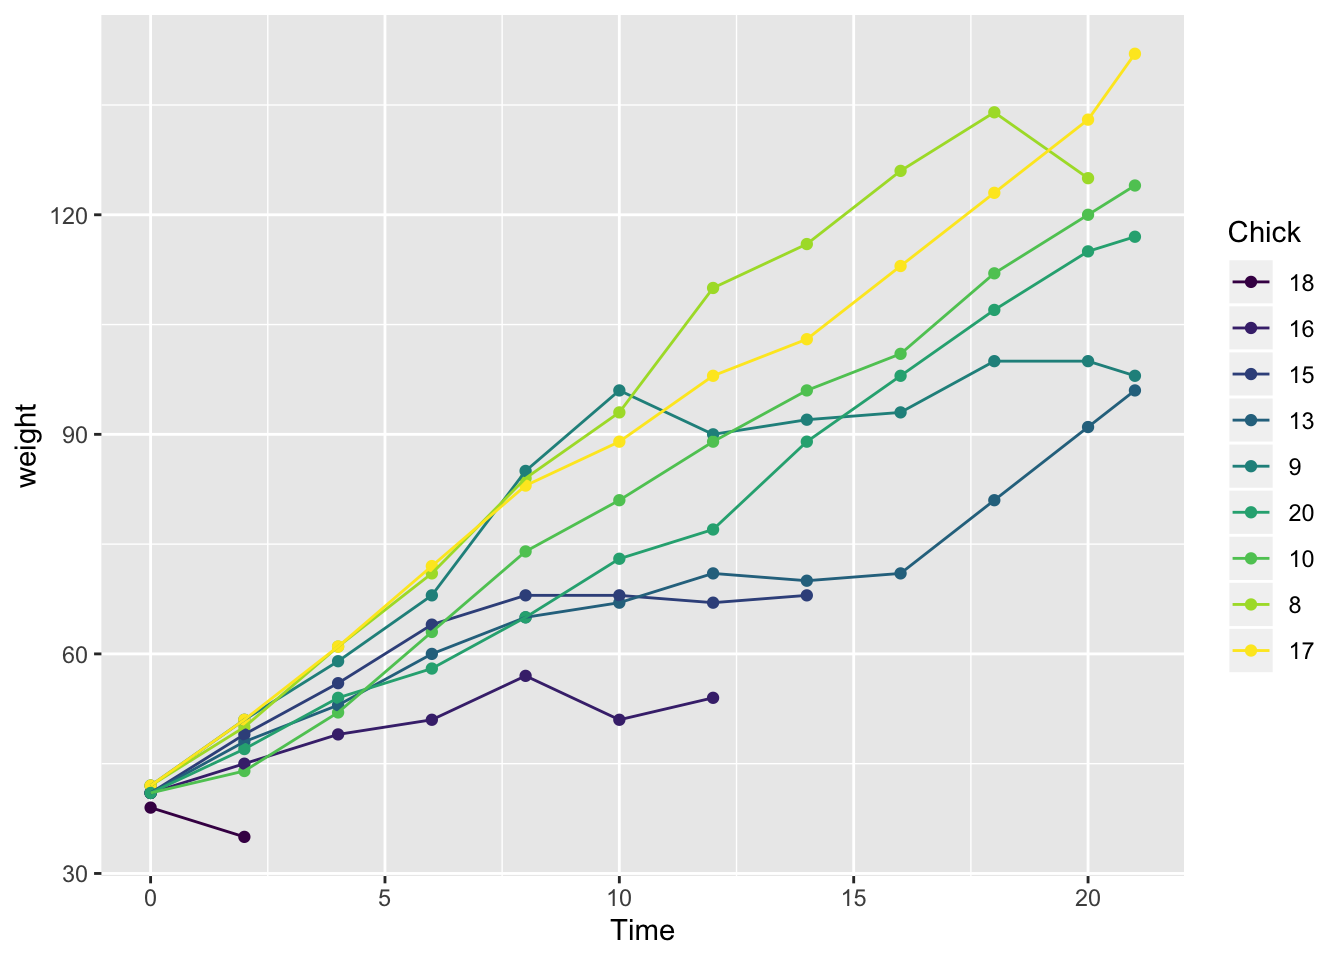
fct_reorder2(x, y)可按x取最大值时y的值对分组进行排序
# 按time取最大值时weight的取值对Chick进行排序,保证线条颜色与legend一致
ggplot(chks, aes(Time, weight, colour = forcats::fct_reorder2(Chick, Time, weight))) +
  geom_point() +
  geom_line() +
  labs(colour = "Chick")