ggplot修改连续坐标的范围
xlim和ylim用于修改ggplot连续坐标的范围,等价于scale_x_continuous(limits = )和scale_y_continuous(limits=).
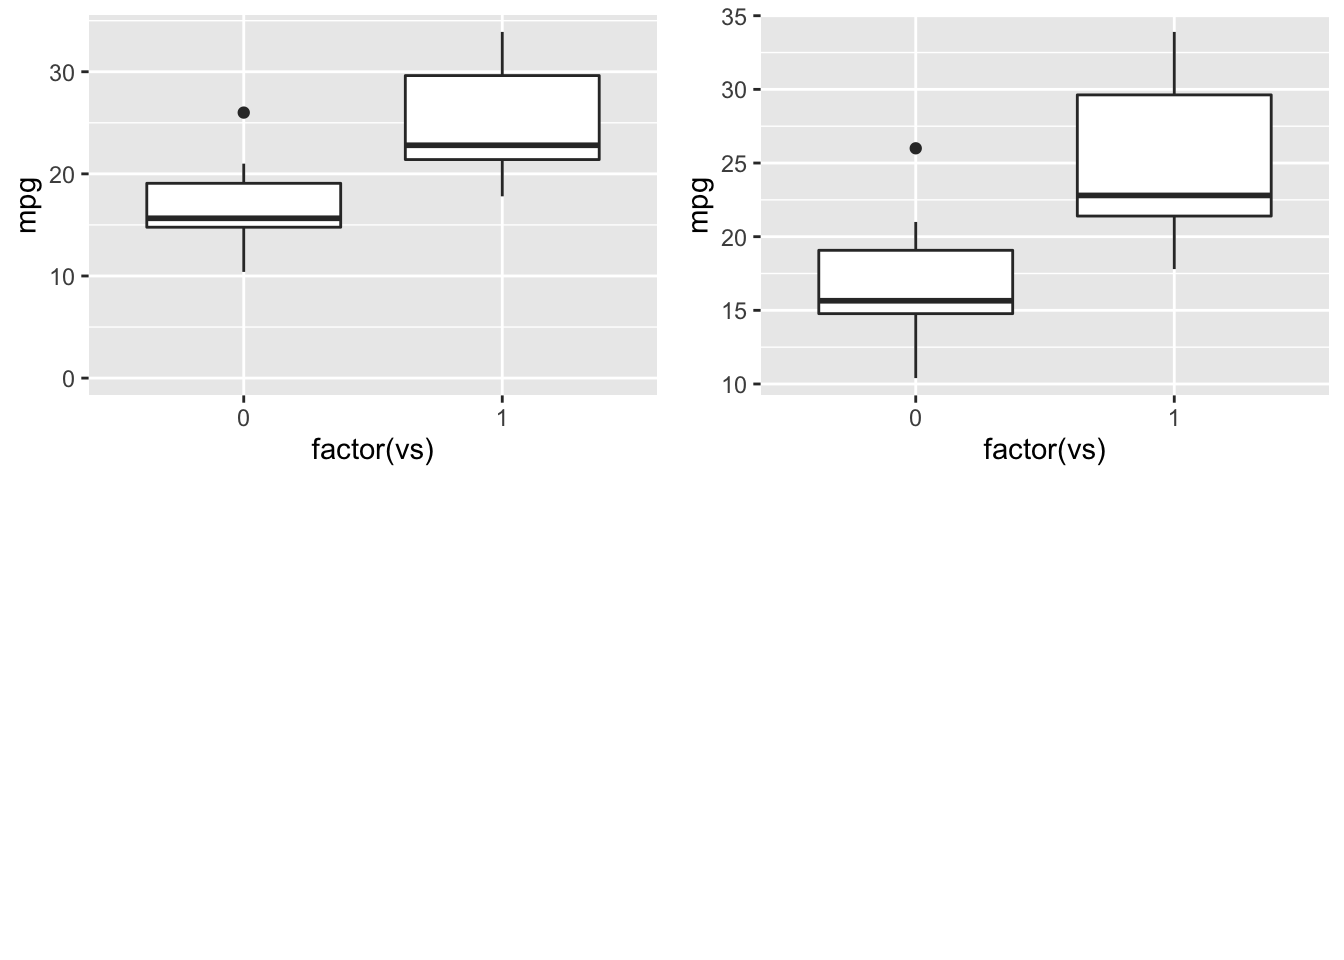
下图展示了默认y的范围及使用ylim和scale_y_continuous(limits=)修改其范围
library(ggplot2)
p1 <- ggplot(mtcars, aes(factor(vs), mpg)) +
  geom_boxplot()
p2 <- ggplot(mtcars, aes(factor(vs), mpg)) +
  geom_boxplot() +
  ylim(0, max(mtcars$mpg))
p3 <- ggplot(mtcars, aes(factor(vs), mpg)) +
  geom_boxplot() +
  scale_y_continuous(limits = c(0, max(mtcars$mpg)))
cowplot::plot_grid(p1, p2, p3, ncol = 2)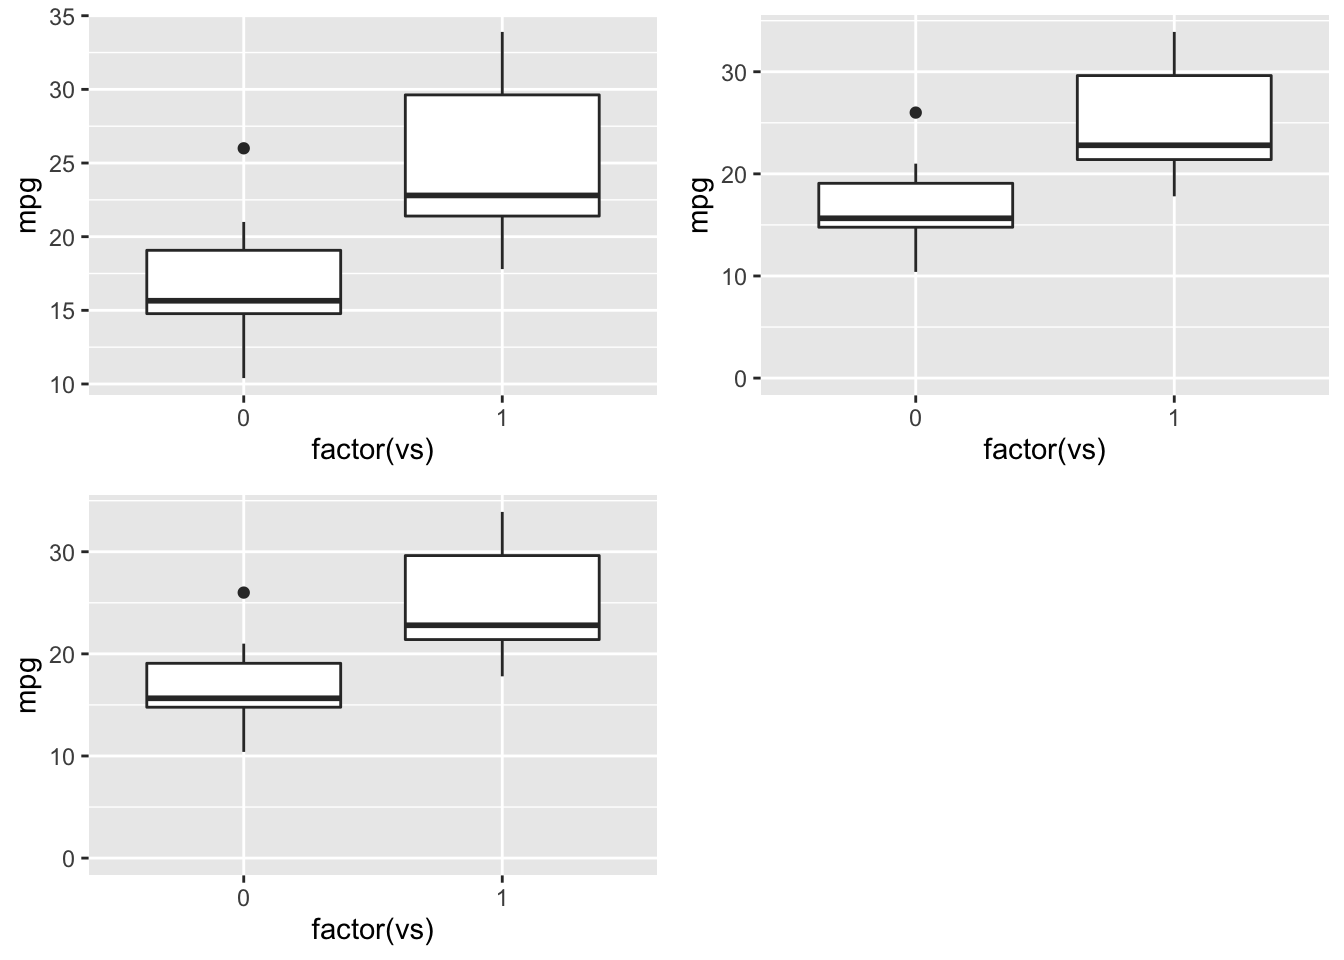
我们还可以使用坐标变换(如coord_cartesian)修改范围,与上述方法不同的是,如果有些数据在设置的范围之外, scale方法是删除范围之外的值再进行作图,坐标变换依然是对所有数据作图(仅仅是对指定范围内的图形进行缩放)。
p1 <- ggplot(mtcars, aes(factor(vs), mpg)) +
  geom_boxplot() +
  scale_y_continuous(limits = c(15, 20))
p2 <- ggplot(mtcars, aes(factor(vs), mpg)) +
  geom_boxplot() +
  coord_cartesian(ylim = c(15, 20))
cowplot::plot_grid(p1, p2, nrow = 1)
## Warning: Removed 19 rows containing non-finite values (stat_boxplot).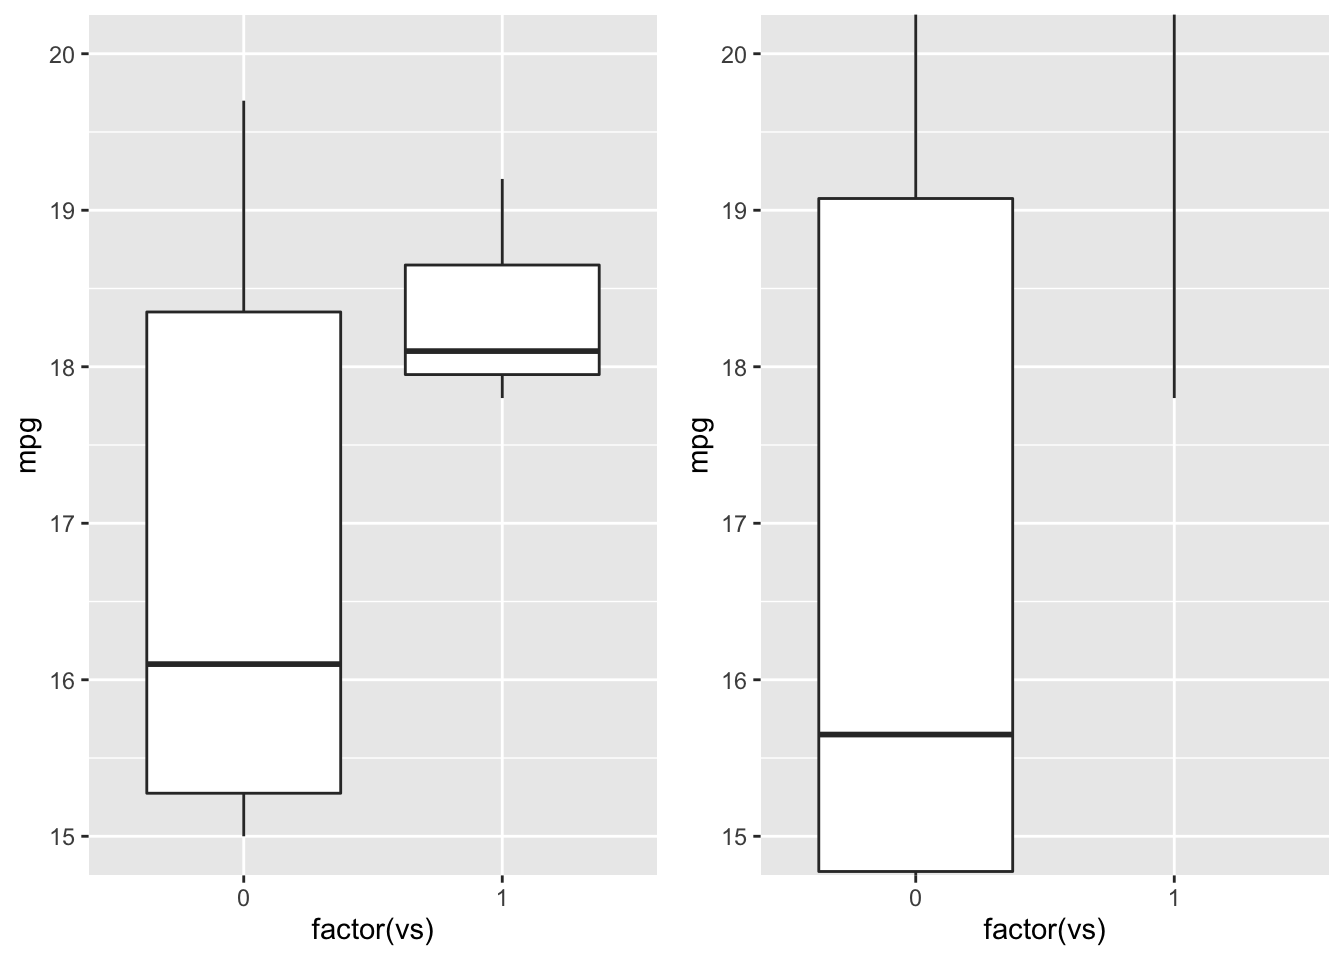
此外,expand_limits()可用于单向扩大修改坐标范围
p1 <- ggplot(mtcars, aes(factor(vs), mpg)) +
  geom_boxplot() +
  expand_limits(y = 0)
# 不能用于缩小范围
p2 <- ggplot(mtcars, aes(factor(vs), mpg)) +
  geom_boxplot() +
  expand_limits(y = 15)

cowplot::plot_grid(p1, p2, norw = 1)
## Warning in as_grob.default(plot): Cannot convert object of class numeric
## into a grob.